Dashboard
The Dashboard of the app has the following appearance.
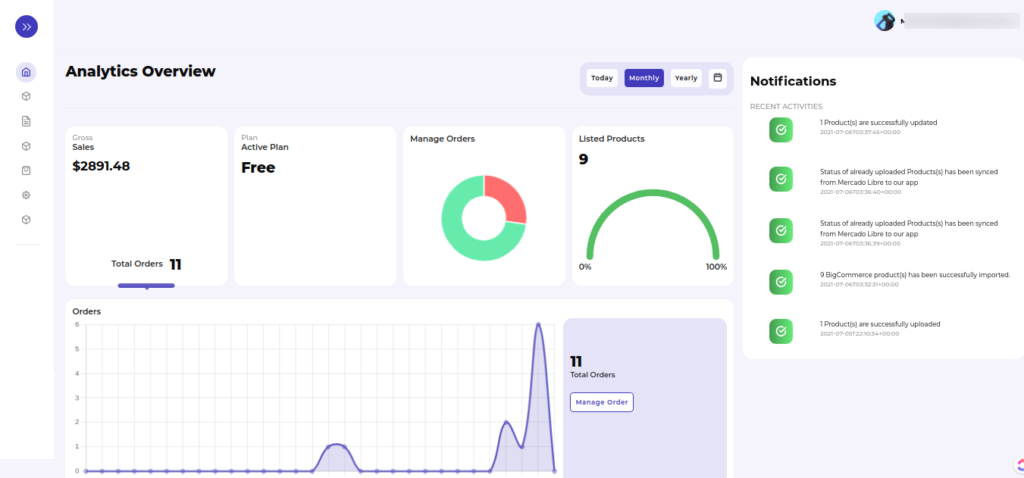
App Dashboard displays the following information:
Gross Sales
Here you can see the total sales in $, along with the total number of orders placed. The section depicts the overall sales rates in dollars.
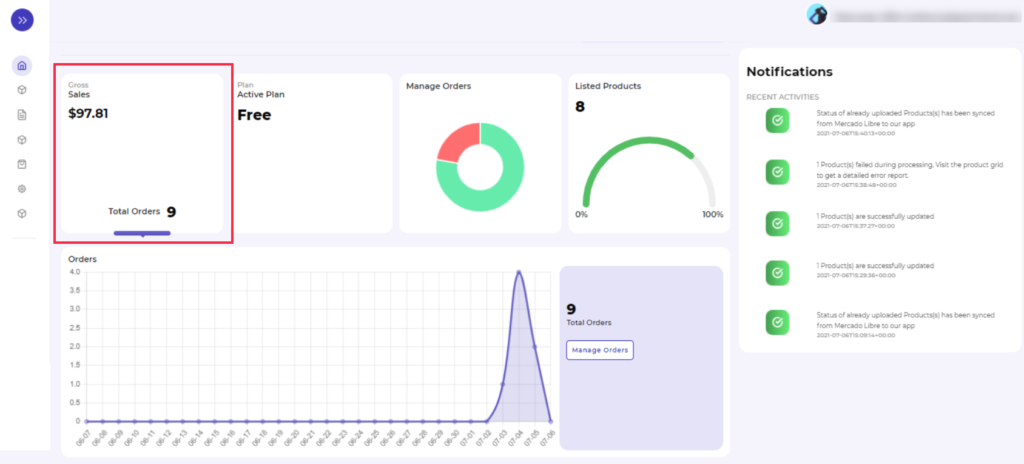
Plan
Here you will find the type of plan you’ve chosen, and the section displays whether your plan is monthly/yearly subscription-based.
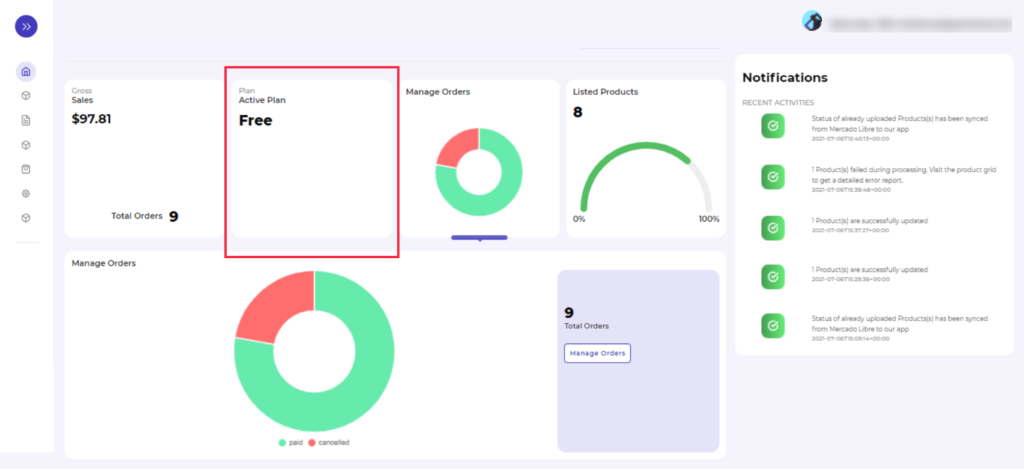
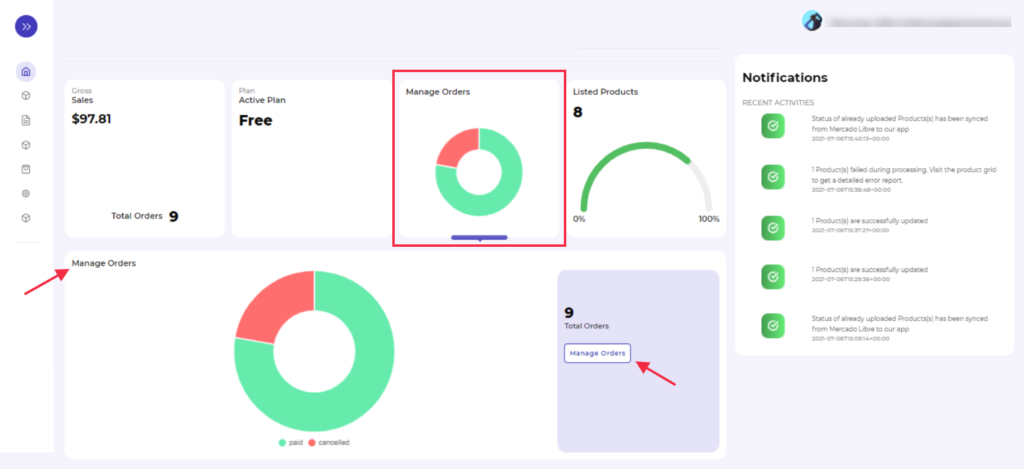
Manage Orders
The section here provides you with the statistics of the total number of orders received, along with a pie chart depicting the percentage of paid and skipped orders. It also has a “Manage orders” tab that will redirect you to the Manage orders section and from where you can view order details like when it was received, Order ID, etc.,
Listed Products
Here you will find the total number of products that are listed in the app. On clicking the Listed Products section, you will get a complete overview of the listed products along with a pie chart depicting the number of products that are published, have errors, are under review, paused, or are not uploaded, as shown in the image below.
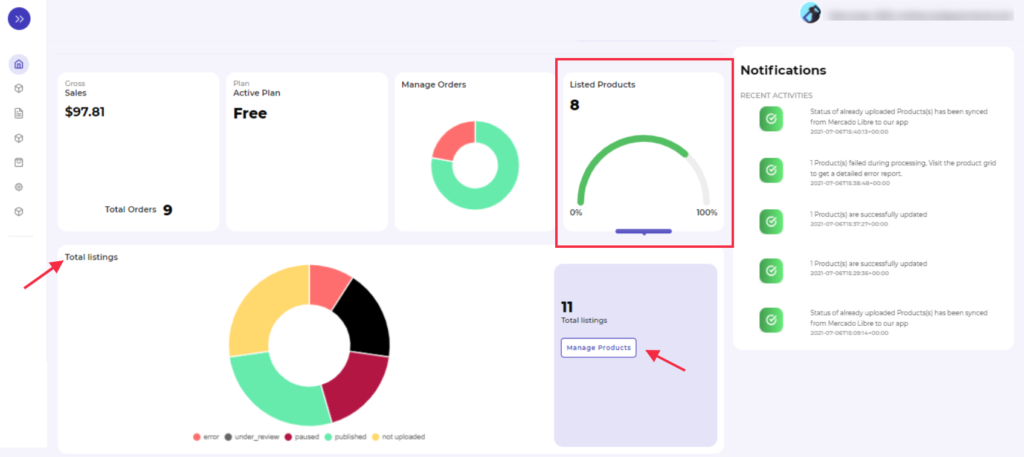
Besides, the section also provides you a redirect tab of “Manage Products,” from where you can review all product details in-depth.
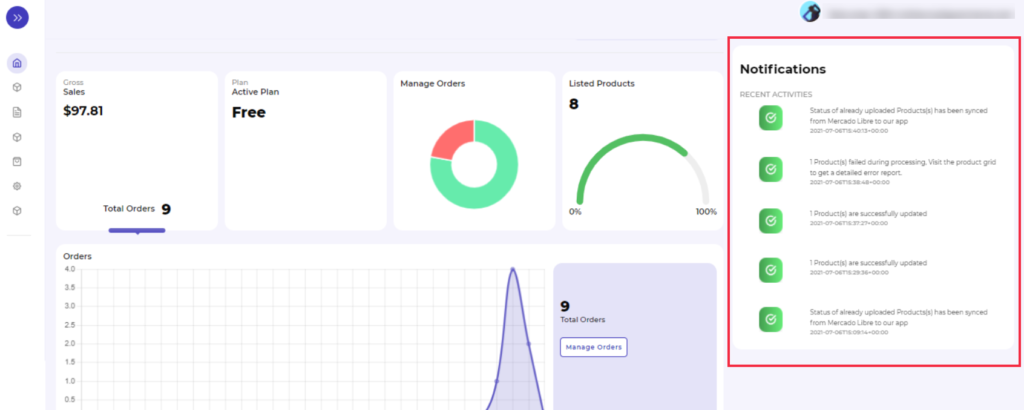
Notifications
The notifications section provides you with a complete list of all the recent activities or changes/updates within the app.
Related Articles
How to install Mercado Libre integration app?
Now there are two ways to install the Mercado Libre BigCommerce Integration app. BigCommerce app store - if you wish to install the Mercado Libre integration app directly. BigCommerce Channel Manager - you can also install the app through BigCommerce ...Listings Section
The product section allows users to navigate and manage listings one at a time or through bulk action. In addition, the interface provides complete information regarding products like their title, image, price, quantity, status, and activities. The ...Category Mapping Section
In the Category Mapping section, you can select the categories in which you want to upload products, map the Mercado Libre attributes with BigCommerce attributes and select the pricing template. Why is Category Mapping Done? For example, If you are ...Overview
Headquartered in Buenos Aires, Argentina, Mercado Libre is a firm that hosts the most extensive online commerce and payments ecosystem in Latin America. Operating through the following geographical segments: Brazil, Argentina, Mexico, Venezuela, and ...Orders Section
This section is to monitor order management between the store and marketplace. As an order gets placed on the Mercado Libre, it gets transferred to our app and then it shows in the BigCommerce store in the order section. Once the shipment status ...